3 min read
3 Trendline Strategies
Trendlines can be great trading tools if used correctly and in this post, I am going to share three powerful trendline strategies with you.

In trading, everyone always wants to complicate everything – why? Simply because having 8 screens with a lot of blinking lights is what we see on TV whenever we hear the word trader. Now while some of the infos these people in the pit, or wherever, have on their screens are certainly beneficial, I promise you, you can trade just as profitably with one screen alone and only 1 to 3 indicators, or even no indicators. You don’t even have to read the tape, the DOM, the ladder, the matrix, whatever. You simply have to observe, mainly: lows and highs, and where they occur in relation to the last lows and highs. Sounds familiar? Enter the 1-2-3 pattern. Or, A-B-C pattern, to your liking.
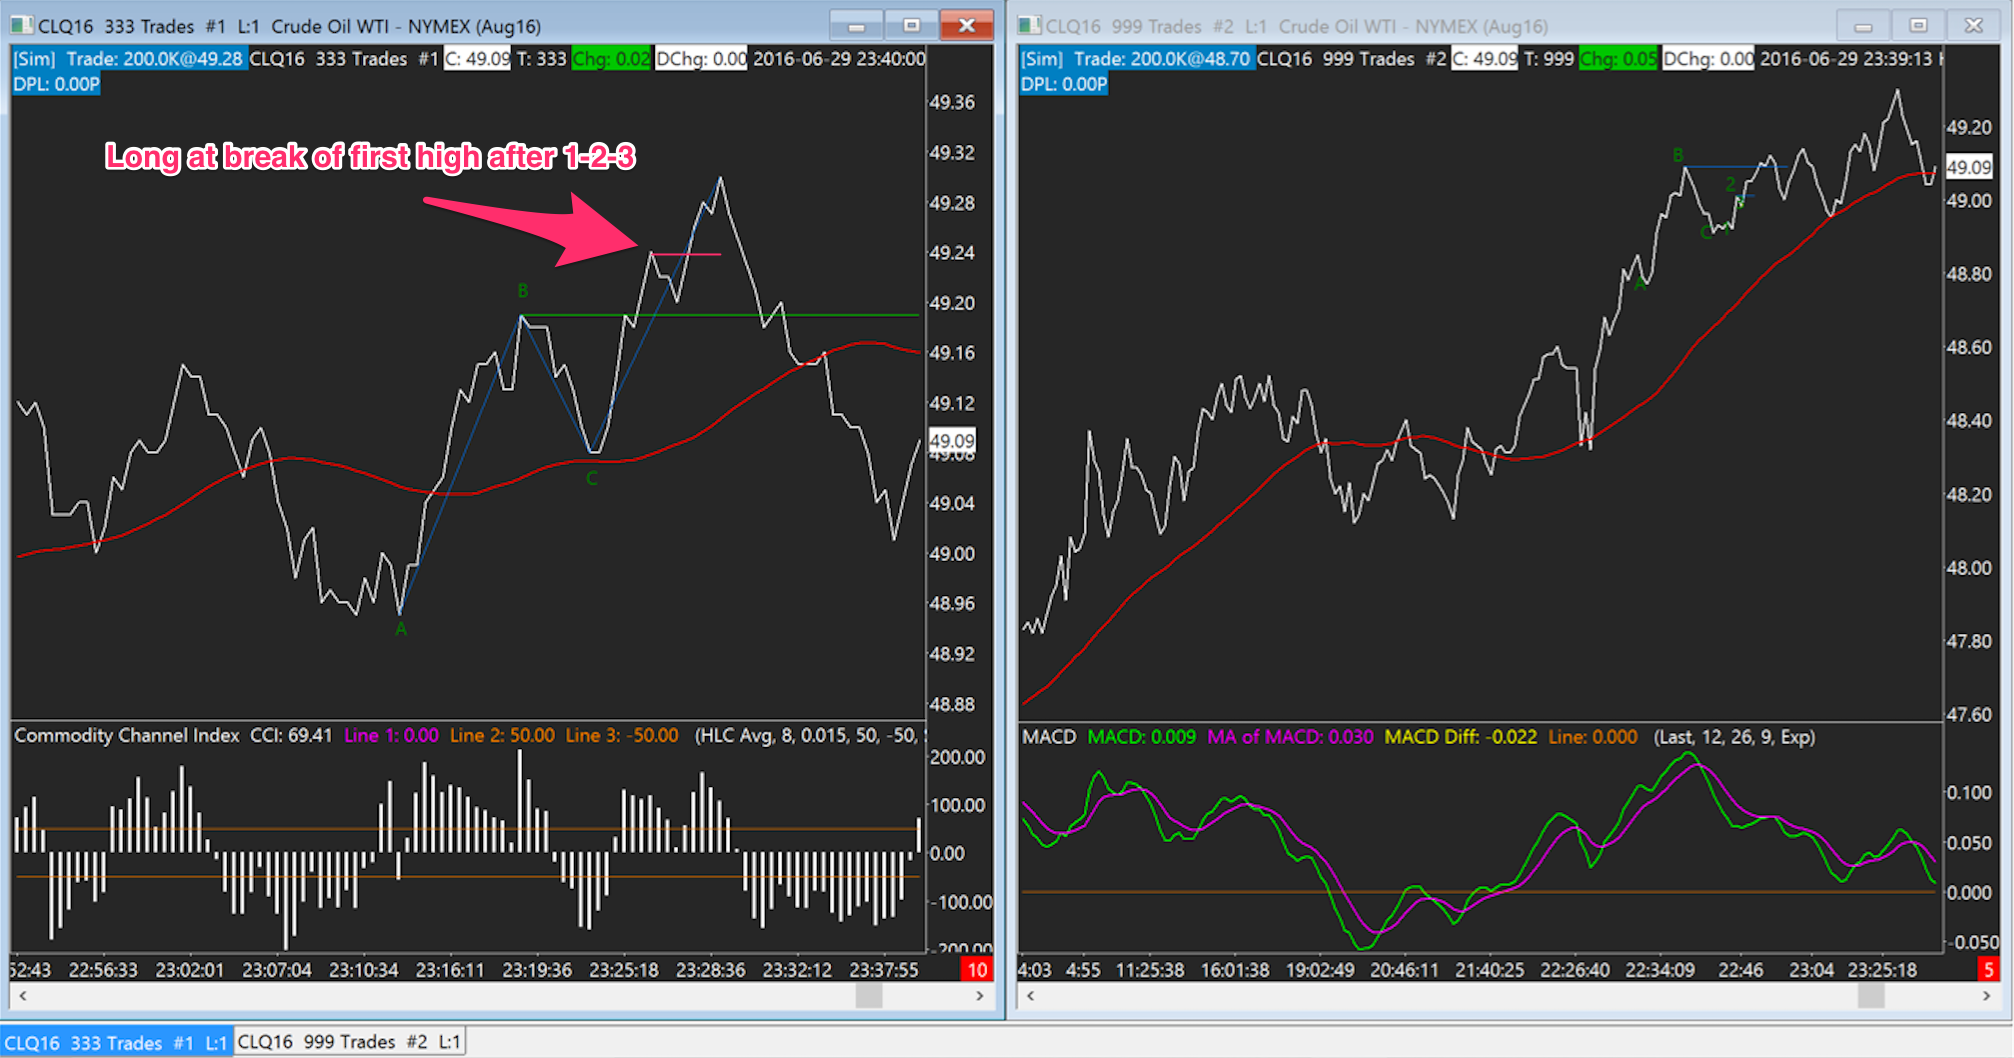
This pattern is comprised of a low, a higher high, a higher low, and a break of the higher high (in case we are going long). In the picture above, at the break of point B we are going long, stops go below point C. Some people set a pending order at B, some people wait for a confirmed break. The 1-2-3 pattern works best when going with the trend but can also be used as a reversal pattern when bouncing from S/R and after we have topping structures in place like H&S, double/triple tops and bottoms, etc. The 1-2-3 brings enough momentum with it that we almost always can go to breakeven before price reverses on us, and if it doesn’t, we can get great runs out of this momentum pattern.
Targets are usually Fibonacci extensions and/or the next S/R level, or when we see signs of price exhaustion like divergence on one of our indicators. Here is an example where when the 127.2 extension reached, I usually target the 161.8 – however in this case it was not reached.
Now there is something called the trader’s trick entry, coined by Joe Ross (who also coined the Ross Hook, will get there in a minute). This entry method suggests actually entering between point C and B, before point B is reached – and actually going to breakeven when point B is reached. That way we can make sure we are not going long at a market top. This can be achieved by using Fibonacci retracements, S/R retests, and by other means – what I usually do, however, is to simply look for another 1-2-3 between point B and C, in order to get in (or other patterns, but this is material for another article). Here is an example:
As you can see in the picture above on the right side, between point B and C of the original pattern, we got another 1-2-3 which we could use to get in before we actually reached point B, which in this case saved us from a stressful trade – it would not have been a loss as our SL always goes below point C, but it would have been stressful to say the least.
Now, after point B broke, we have two additional means of stacking our position. One is the retrace to point B, as in this example:
And finally, the so-called Ross Hook (basically another 1-2-3), which is the first retrace after a successful 1-2-3 formation. In the example above, we would enter as follows.
So, there you have it, a potential 3 entries on one formation. Important is that you know where the overall trend is going, and that you don’t trade every tiny retrace. This is where my indicators come into play: I use the MACD on the longer timeframe window to confirm momentum, and the CCI on the trading timeframe window to confirm that a pullback has indeed been deep enough to build up enough momentum to the other side (swingin’, swingin’).
If you spot patterns like Head and Shoulders, double tops/bottoms, and other popular topping structures, on the higher timeframe, and a 1-2-3 on the lower timeframe, you got yourself a great trade. Or, you wait until a high or low gets broken on the higher timeframe, and then wait for a 1-2-3 on the lower timeframe to get in. All viable options to enter with the trend, with the momentum, and with structure in your back to protect your stoploss.
Overall, the 1-2-3 is an incredibly awesome pattern that follows the simplest market analysis there is: where are our highs, and where are our lows, and in which relation to each other did they appear on our charts?

3 min read
Trendlines can be great trading tools if used correctly and in this post, I am going to share three powerful trendline strategies with you.

3 min read
Choosing the right trading journal is essential for traders wanting to analyze performance, refine strategies, and improve consistency. In this...

4 min read
Trading successfully depends on recognizing market structures and patterns that indicate whether an existing trend will continue. Trend continuation...