3 min read
Scientist Discovered Why Most Traders Lose Money – 24 Surprising Statistics
“95% of all traders fail” is the most commonly used trading related statistic around the internet. But no research paper exists that proves this...


Marty Schwartz has always been my favorite trader from the Market Wizards book and I recently read his own book (Pit Bull: Lessons from Wall Street’s Champion Trader). In the following article I would like to discuss and revisit 11 of his personal trading rules and principles, which I also use to some degree in my own trading, that could help other traders improve their own trading and provide some insights how a professional trader approaches trading.
This principle means that once price starts trending, there is a good chance that the trend will continue. Amateur traders always try to call tops and bottoms and enter trades counter to the ongoing trend, although riding the existing trend would often yield much better results.
The graph below shows the price of the S&P500 (black line) and the green and red bars mark new 3 months highs and lows. At first glance, it becomes obvious that periods in which price continues to make new highs or lows can last long and occur frequently; the white areas where no new high or low is made occur less frequently.
Therefore, if you continuously try to call tops and bottoms, but you often find yourself on the wrong side of the trade, it may be a good time to re-think your approach.
Here we don’t want to explicitly talk about the indicator itself (just google Terry Laundry T Theory) , but about the underlying price principles that the indicator is built upon. At its core, the T theory states that the markets spend the same amount of time going up and down. Hence, it refers to a ‘T’ because the two lines, left and right to to center line, are equally long.
The graphic below shows the %-share of positive daily closing prices over a one month period for the S&P 500 since 1990. It is obvious that the peak is around 55% and 50%, which means that 50% to 55% of the time, the S&P 500 has a daily positive closing price, which may confirm the T theory to some degree; prices go up and down the same amount of time. It is noteworthy that outliers exist and that in some periods price closed positive more than 80% of the time (16 out of 20 monthly trading days) and other times, price closed positive less than 25% of times (5 out of 20 monthly trading days). It is not surprising that our analyses also show that within uptrends there are more positive daily closes and during downtrends, the daily positive closes are less, which may help to understand the outliers.
However, combined with the previous point, it becomes clear that a trader may do much better when he is not trying to fight the ongoing trend and tries to continuously call tops and bottoms, but just to participate in a trending market.
 Marty Schwartz uses a 10-period exponential moving average (Ema) to distinguish between bullish and bearish scenarios and as a filter. Whenever price is above the 10 period EMA he looks for buy trades and when price is below the 10 period Ema, he is looking for short opportunities.
This approach and rules can be especially helpful when used as a filter criteria. For example, a trader could use a 10 period Ema on the daily or weekly time-frame to determine the direction of his trades. Then he can go to the lower time-frames where he executes his trades and only looks for trades in the direction which the Ema suggests.
Again, together with the previous principles, a trader could create a sophisticated set of rules and filter criteria for his own trading.
In my trading strategy, a moving average is also at the core of all trading decisions.
Moving averages and the 10 period EMA rule are vulnerable in range-bound markets when price usually does not respect the moving averages very well and continues to break above or below the moving average many times. This is when his stop loss tip could help you avoid whipsawing.
Amateur and inexperienced traders often use very similar approaches to their stop loss placement which makes it easy to “guess” where the majority of stop loss orders are (in another article we discussed this phenomenon with regards to round numbers). Therefore, if you notice that your stop loss orders often get hit, but then price reverses in the opposite direction, it may be time to re-think your approach. And no, it is usually not your broker hunting stops, but just the fact that you use “too obvious” and very common strategies for stop placement.
Marty Schwartz used the Put/Call ratio as a contraction indicator. In another article, we touched on this topic already and you can see here why it can pay to use the Put/Call ratio to identify what the average trader is doing (wrong).
 When it comes to news and fundamental data, most traders just focus on the actual numbers and then wonder why the markets are not behaving according to the news release. Marty Schwartz uses price reaction to news releases and fundamental data to understand the strength and market sentiment.
For those reasons, it is important to put everything in context when it comes to understanding price reactions to fundamental data. We provide a list of news tools, websites and resources to stay on top of what is happening daily.
 The work ethic of Marty Schwartz is incredible and it highlights the discipline a trader needs. For example, he draws all his charts by hand and uses physical paper for his charting. He says that it helps him “connect” with his instruments better and although it requires much more time, the benefits are huge.
Most traders randomly flip through hundreds of instruments, arbitrarily add some horizontal lines, play around with indicators until they accidentally find something that may look like an entry signal. A little bit more mindfulness and a more thought-out trading process would help traders achieve a more professional approach.
Marty Schwartz’ discipline, work ethic and routine are the main reasons for his outstanding success and it underlines the difference between the approach of the average losing trader and the consistently winning trader.
 When it comes to making trading decisions, Marty Schwarz has two great tips:
“I review my checklist. It’s a handwritten sheet laminated in plastic and taped to the right-hand corner of my desk where I can’t overlook it.”
“If you have a game plan prepared ahead of time, it can help you find courage in the heat of the battle.”
A physical checklist that states all your entry criteria can help you avoid impulsive and emotionally driven trading decisions (mistakes). If you can actually see that the trade that you are about to take goes against our rules, you are more likely to avoid that trade, or you have to make an active and conscious decision to break your rules.
A trader should also prepare a trading plan before the market opens, analyze his instruments and write down potential trade scenarios. A trading plan can help reduce stress during open market hours and also provide guidance during the trading process. If you are unsure about a trade, review your plan, see what your initial thoughts were and then make a decision whether the trade matches your criteria or not. In our pro course, you will get my detailed checklist with additional trading tips.
 Before pulling the trigger, step back and evaluate the trade. Compare it with your checklist and your trade plan. Does it really match your criteria or are you violating some of your rules? Is your trading decisions emotionally driven or based on sound trading principles? Are you chasing a trade, trying to play catch up or trading for excitement?
Just waiting a few moments, reflecting what you are about to do and whether it is really what you should be doing, can help you stay out of bad trades.
Confidence and mindset is obviously a very important aspect of trading. During a winning streak, many traders become too confident, believe that they suddenly can’t fail anymore and that they have a gut feeling for what is going to happen. Subsequently, traders tend to violate their trading rules in such periods, enter trades prematurely and even increase their risk significantly, which eventually results in large losses because every winning streak has to end eventually.
“Most people think that they’re playing against the market, but the market doesn’t care. You’re really playing against yourself. You have to stop trying to will things to happen in order to prove that you’re right. Listen only to what the market is telling you now. Forget what you thought it was telling you five minutes ago. The sole objective of trading is not to prove you’re right, but to hear the cash register ring.” – Marty Schwartz
The last point includes two very important concepts:
1) Don’t let your ego get in the way of a trade
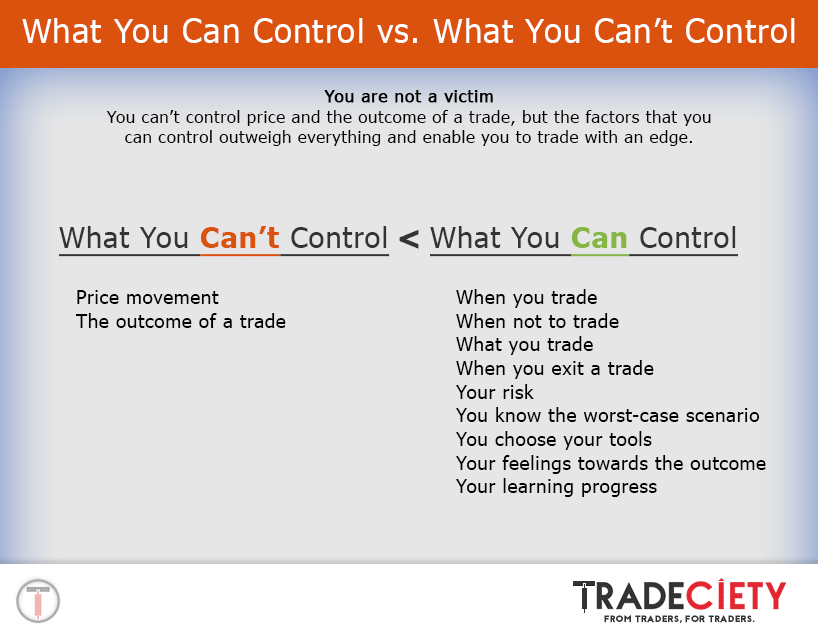
2) YOU are always responsible for the outcome
First, although a trader needs confidence and trust in his abilities and his method, he has to understand that he cannot control the outcome. The market dictates what is going to happen and a trader’s job is to react accordingly. If you personalize losses and want to will a trade to win, it usually ends in a disaster. Therefore, think process-oriented, realize losses fast and move on to the next trade.
Additionally, blaming outside circumstances or the markets leads to emotional trading and delusional thinking. Although the market dictates what is going to happen, YOU are the one who is making the trading decisions. You are entering and exiting trades and, therefore, you have to understand that over the long term, you are the most important factor of your trading strategy.

image credit – traffic light: marfis75 on flickr

3 min read
“95% of all traders fail” is the most commonly used trading related statistic around the internet. But no research paper exists that proves this...

3 min read
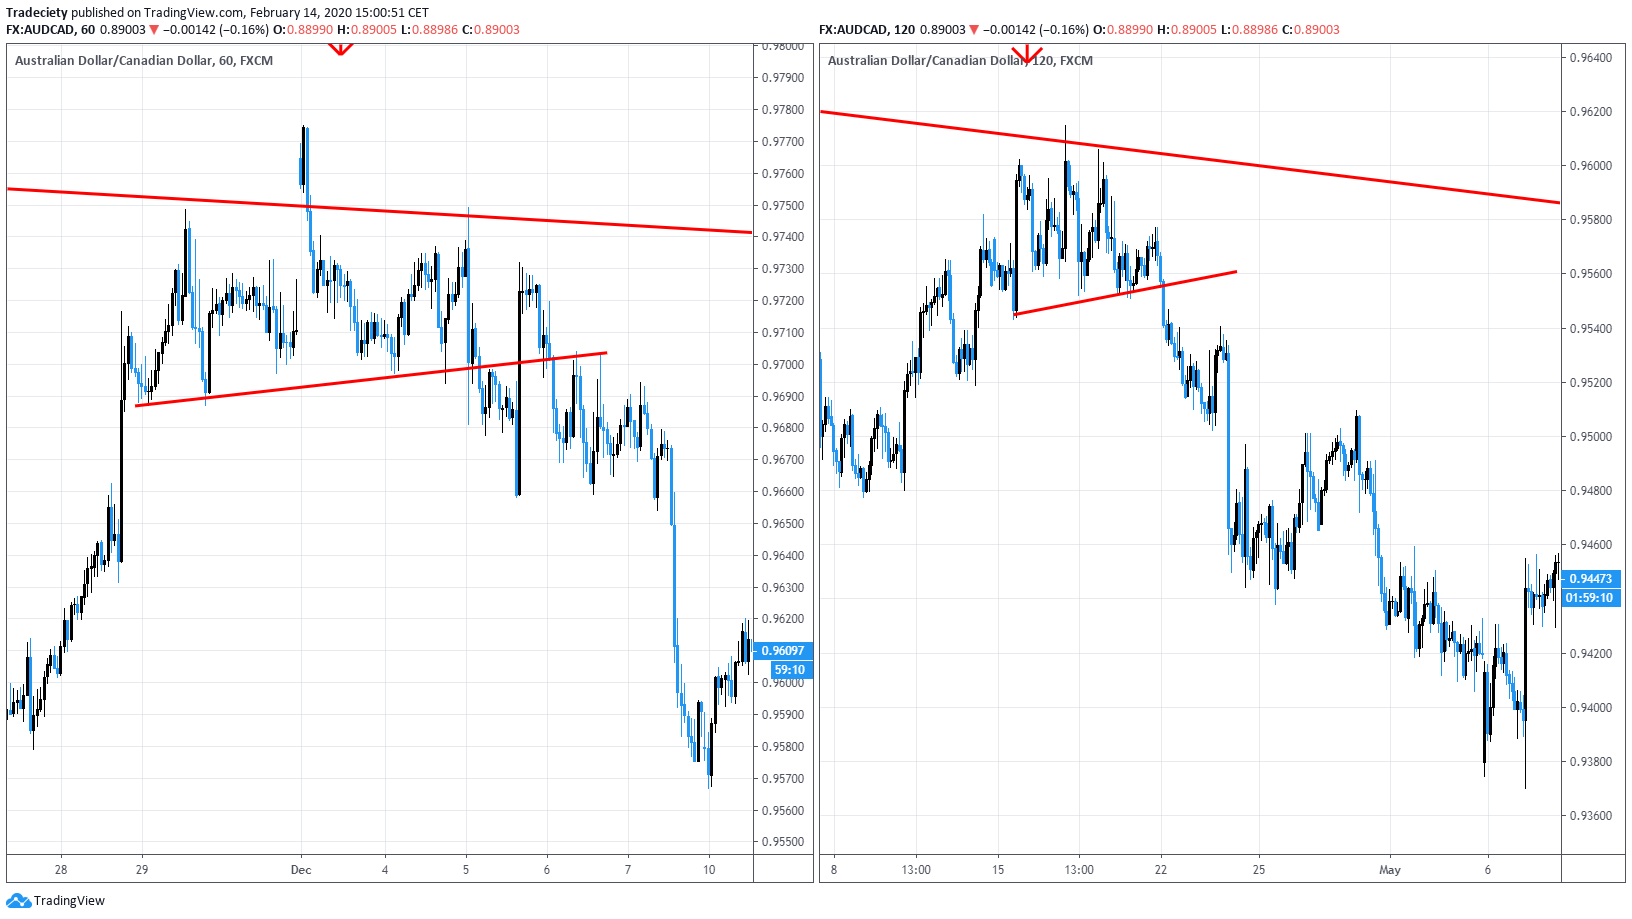
Trendlines can be great trading tools if used correctly and in this post, I am going to share three powerful trendline strategies with you.

3 min read
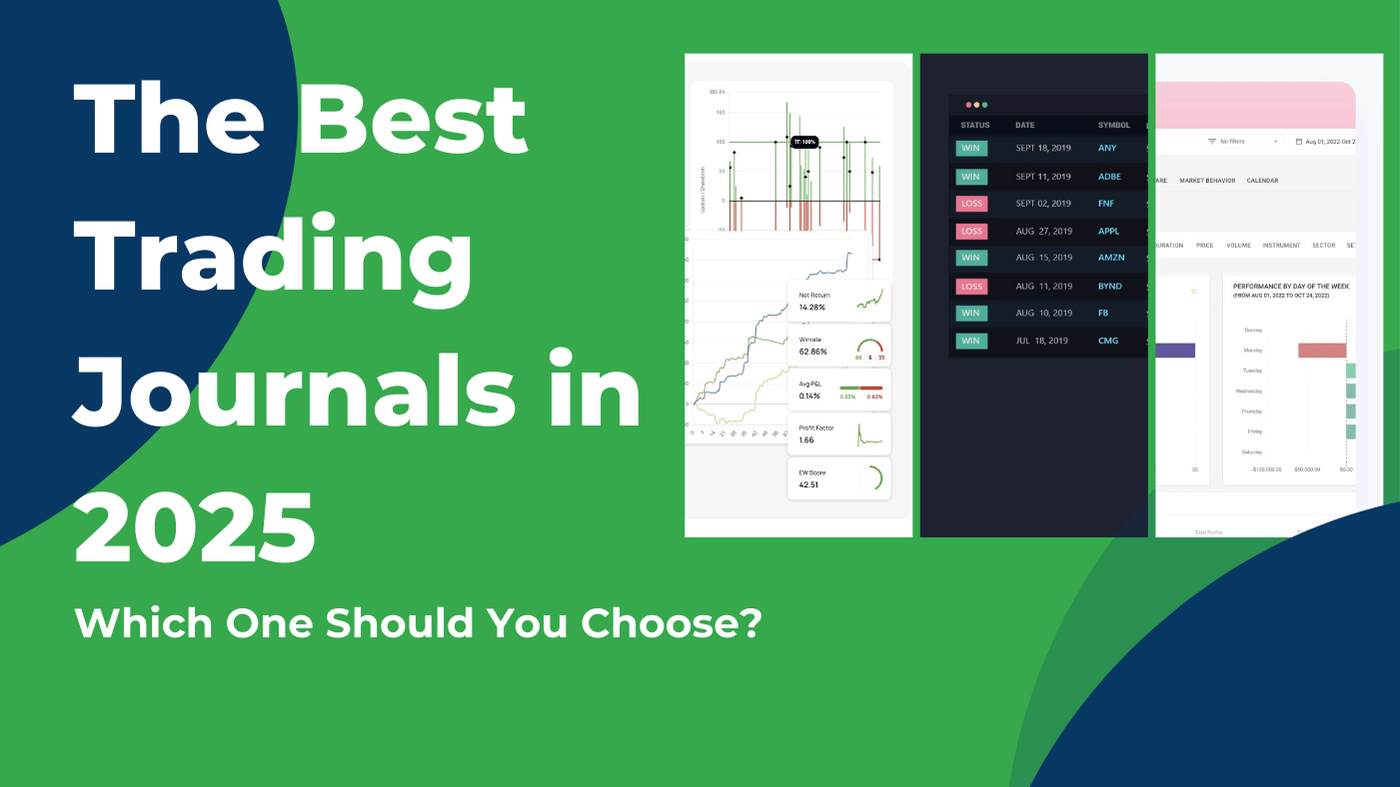
Choosing the right trading journal is essential for traders wanting to analyze performance, refine strategies, and improve consistency. In this...