3 min read
Scientist Discovered Why Most Traders Lose Money – 24 Surprising Statistics
“95% of all traders fail” is the most commonly used trading related statistic around the internet. But no research paper exists that proves this...

Just a single divergence is not a strong enough signal and I typically recommend building confluence (other signals) around divergence systems.
In this article, I introduce a different approach to trading divergences and the so-called double divergence can potentially improve the signal quality, compared to regular divergences.
A short recap: As we have said in a different article, a divergence on the RSI indicator signals losing momentum. The screenshot below shows that, on the left, the price made a higher high, but the RSI did not make a new high. This tells us that the price action wasn’t actually that strong and although the price moved higher, the candles leading up to the new top weren’t as strong. The RSI, which analyses candle strength, confirmed it with the divergence.
The next example shows that the price made new lower lows during the downtrend. Again, the RSI didn’t confirm this move and made higher lows, indicating that the candles moving lower did not show a lot of bearish strength.
More about divergences: What is a divergence really telling you
Every trader who has traded divergences before knows that the prediction value of a divergence alone is oftentimes not very high and especially during established trends, divergences are not a reliable sign for a price reversal. That’s when the double divergence comes in.
A double divergence occurs when a series of multiple higher price highs forms (or lower lows) while the indicator prints lower highs. In the screenshot below, we use the MACD histogram, but you can use the RSI or any other momentum indicator as well.
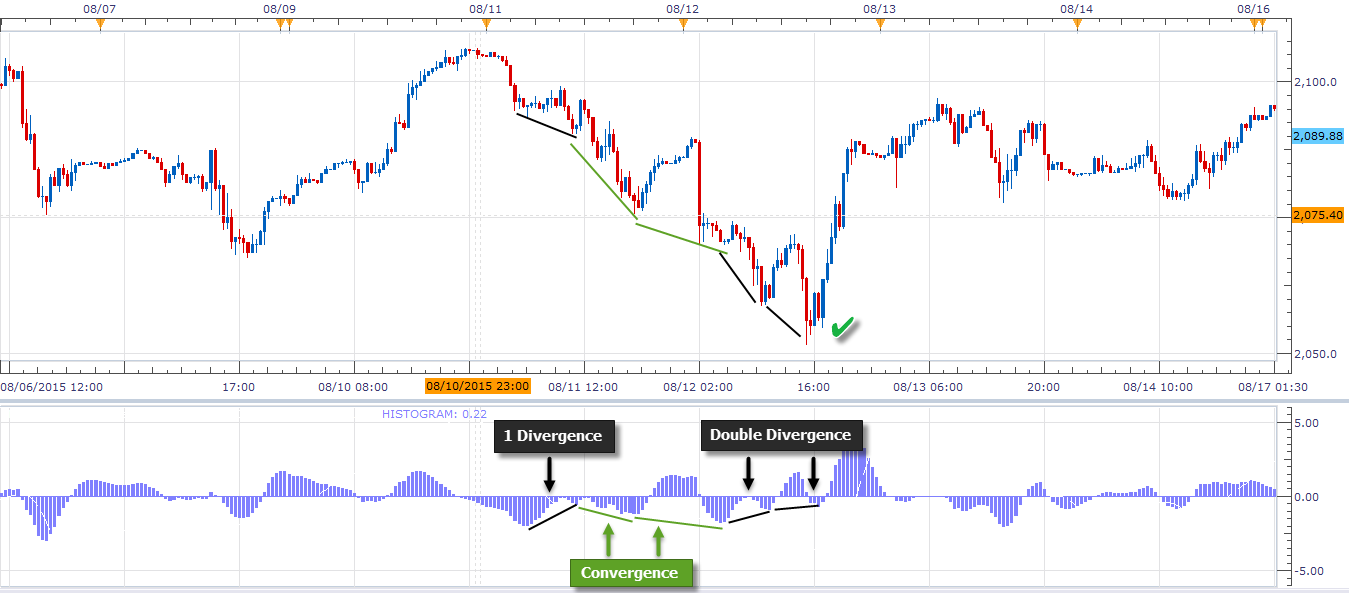
The screenshot below shows a double divergence during a downtrend. Looking at price only already shows that the trend waves are becoming shallower and less strong. The price cannot as easily push lower and each trendwave is weaker.
The MACD shows multiple divergences, but just going with the first divergence alone would be a losing system. The patient trader would wait for multiple divergences to form. Also, it is advisable to wait until the price makes a new higher high and completely signals a trend shift.
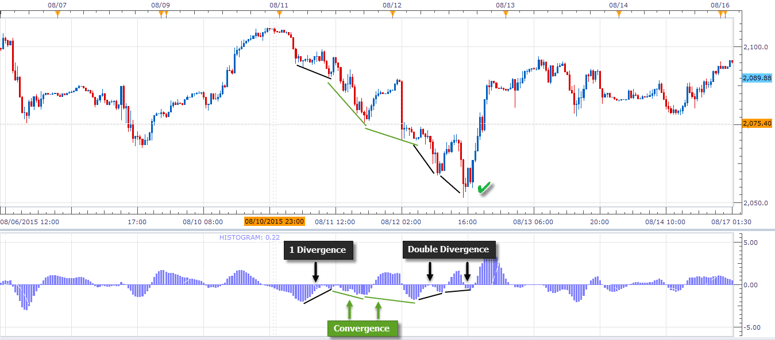
The screenshot below shows another example of a double divergence. At first, we saw a regular single divergence but the price did not reverse and kept on going lower.
Then, the MACD confirmed the downtrend once again and posted lower lows (green lines – convergence). After the convergence, the trend weakened and the trend waves became shorter. The MACD now shows a double divergence and the market reversed higher.
Thus, trading a single divergence on its own does provide less accuracy compared to a double divergence. Of course, sometimes a single divergence will cause a trend reversal already, but waiting for double divergences could increase the trade quality.

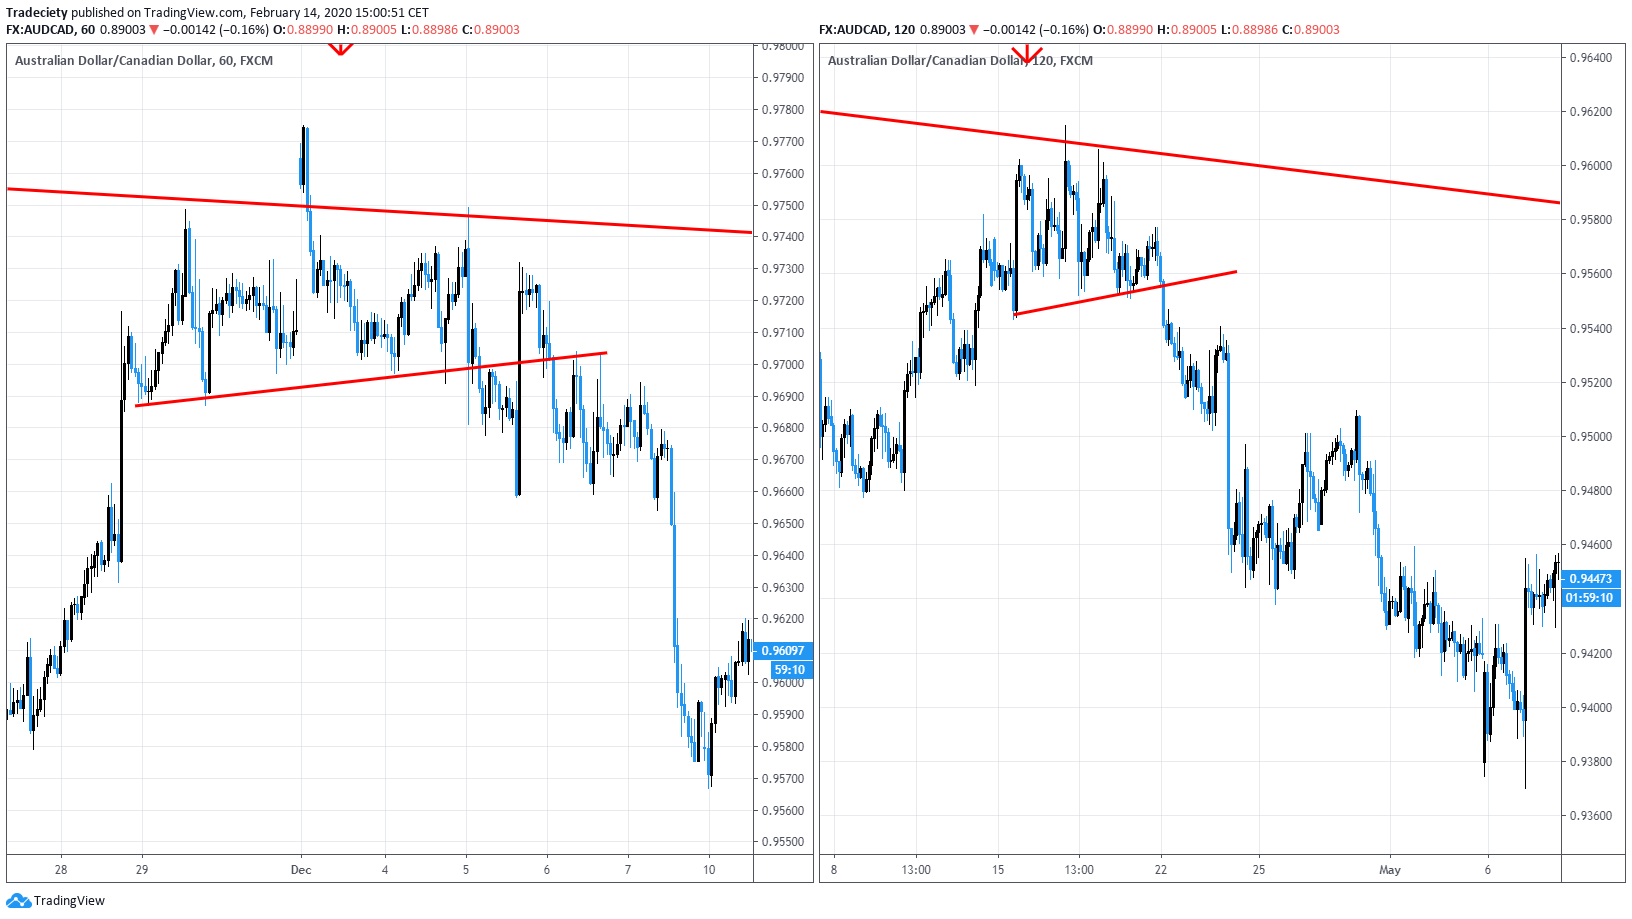
The last screenshot shows a double divergence and it is also apparent that the price action is becoming increasingly weaker. The price candes and trend waves leading lower are short and not as strong.
At the bottom, the price also printed a pinbar which is generally considered a reversal signal if it occurs in the right context.
This article provides insightful information about how to improve signal quality. Of course. waiting for a double divergence to occur requires more patience because it does not happen as often as a single divergence, but reducing system noise and adding confluence factors can often make a strategy more robust by being more selective.

3 min read
“95% of all traders fail” is the most commonly used trading related statistic around the internet. But no research paper exists that proves this...

3 min read
Trendlines can be great trading tools if used correctly and in this post, I am going to share three powerful trendline strategies with you.

3 min read
Choosing the right trading journal is essential for traders wanting to analyze performance, refine strategies, and improve consistency. In this...